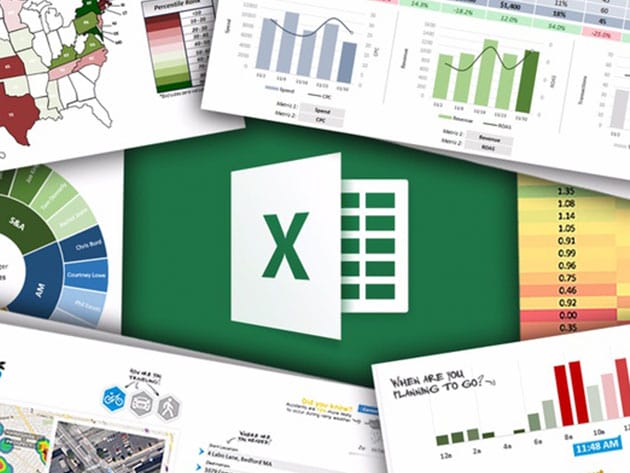
The Ultimate Microsoft Excel Bundle for $25
June 21, 2018 / by Marco / Categories : Business, deals, design, entrepreneur, website

KEY FEATURES
It’s time to show Excel who’s boss! Whether you’re starting from square one or aspiring to become an absolute Excel wizard, this is the right place for you. This course will give you a deep understanding of the advanced formulas and functions that transform Excel from a basic spreadsheet program into a dynamic and powerful analytics tool. Through hands-on, contextual examples, you’ll learn why these formulas are awesome and how they can be applied in a number of ways.
- Access 93 lectures & 6 hours of content 24/7
- Easily build dynamic tools & Excel dashboards to filter, display, & analyze your data
- Go rogue & design your own formula-based formatting rules
- Join datasets from multiple sources in seconds w/ lookup, index, & match functions
- Pull real-time data from APIs directly into Excel
- Manipulate dates, times, text, & arrays
- Automate tedious & time-consuming analytics tasks using cell formulas and functions in Excel
PRODUCT SPECS
Details & Requirements
- Length of time users can access this course: lifetime
- Access options: web streaming, mobile streaming
- Certification of completion not included
- Redemption deadline: redeem your code within 30 days of purchase
- Experience level required: all levels
- Microsoft Excel required
Compatibility
- Internet required
THE EXPERT
Chris Dutton is a certified Microsoft Excel Expert, analytics consultant, and best-selling instructor with more than a decade of experience specializing in business intelligence, marketing analytics and data visualization.
He founded Excel Maven in 2014 to provide high-quality, applied analytics training and consulting to clients around the world, and now mentors 25,000+ students in more than 150 countries. He has developed award-winning data analytics and visualization tools, featured by Microsoft, the New York Times, and the Society of American Baseball Research.

KEY FEATURES
Ask people what comes to mind when they think of Excel and odds are they’ll say, “spreadsheets”. However, Excel is an incredibly powerful, robust, and dynamic data visualization platform. This course will give you a deep, comprehensive understanding of Excel’s latest data visualization tools and techniques. You’ll learn when, why, and how to use each chart type, discover key data visualization best practices, and learn through interactive, hands-on demos and exercises every step of the way.
- Access 49 lectures & 4.5 hours of content 24/7
- Explore each of the 20+ chart types that Excel 2016 has to offer
- Dive into a series of 12+ advanced Excel demos guaranteed to turn you into a data visualization pro
PRODUCT SPECS
Details & Requirements
- Length of time users can access this course: lifetime
- Access options: web streaming, mobile streaming
- Certification of completion not included
- Redemption deadline: redeem your code within 30 days of purchase
- Experience level required: all levels
- Microsoft Excel 2016 required
Compatibility
- Internet required
THE EXPERT
Chris Dutton is a certified Microsoft Excel Expert, analytics consultant, and best-selling instructor with more than a decade of experience specializing in business intelligence, marketing analytics and data visualization.
He founded Excel Maven in 2014 to provide high-quality, applied analytics training and consulting to clients around the world, and now mentors 25,000+ students in more than 150 countries. He has developed award-winning data analytics and visualization tools, featured by Microsoft, the New York Times, and the Society of American Baseball Research.

KEY FEATURES
This course will introduce you to Microsoft Excel’s powerful data modeling and business tools Power Query, Power Pivot, and Data Analysis Expressions (DAX). If you’re looking to become a power Excel user and supercharge your analytics, then this is the A-Z guide that you’re looking for.
- Access 86 lectures & 7 hours of content 24/7
- Use sample data from a fictional supermarket chain to get hands-on w/ Power Query
- Practice shaping, blending, & exploring project files
- Cover the fundamentals of database design & normalization
- Explore & analyze your data model using Power Pivot & DAX
- Cover basic DAX syntax & learn some of the most powerful and commonly used functions
PRODUCT SPECS
Details & Requirements
- Length of time users can access this course: lifetime
- Access options: web streaming, mobile streaming
- Certification of completion not included
- Redemption deadline: redeem your code within 30 days of purchase
- Experience level required: all levels
- You need a version of Excel that is compatible with Power Pivot (Excel 2013/2016 Standalone, Office 365 Pro Plus, Enterprise E3/E5, Office Professional 2016, etc.)
Compatibility
- Internet required
THE EXPERT
Chris Dutton is a certified Microsoft Excel Expert, analytics consultant, and best-selling instructor with more than a decade of experience specializing in business intelligence, marketing analytics and data visualization.
He founded Excel Maven in 2014 to provide high-quality, applied analytics training and consulting to clients around the world, and now mentors 25,000+ students in more than 150 countries. He has developed award-winning data analytics and visualization tools, featured by Microsoft, the New York Times, and the Society of American Baseball Research.

KEY FEATURES
Pivot Tables are an essential tool for anyone who works with data in Excel. Pivots allow you to explore and analyze raw data quickly, revealing powerful insights and trends otherwise buried in the noise. In other words, they give you answers. Whether you’re exploring product sales, analyzing marketing tactics, or wonder how Boston condo prices have trended over the past 15 years, Excel Pivot Tables provide fast, accurate, and intuitive solutions to even the most complicated questions. This course will give you a deep, 100% comprehensive understanding of Pivot Tables and Pivot Charts.
- Access 82 lectures & 6 hours of content 24/7
- Cover raw data structure, table layouts & styles
- Explore design & formatting options
- Understand sorting, filtering, & grouping tools
- Anaylze data from a number of real-world case studies including San Diego burrito ratings, shark attack records, MLB team statistics, & more
PRODUCT SPECS
Details & Requirements
- Length of time users can access this course: lifetime
- Access options: web streaming, mobile streaming
- Certification of completion not included
- Redemption deadline: redeem your code within 30 days of purchase
- Experience level required: all levels
- You need a version of Excel that is compatible with Power Pivot (Excel 2013/2016 Standalone, Office 365 Pro Plus, Enterprise E3/E5, Office Professional 2016, etc.)
Compatibility
- Internet required
THE EXPERT
Chris Dutton is a certified Microsoft Excel Expert, analytics consultant, and best-selling instructor with more than a decade of experience specializing in business intelligence, marketing analytics and data visualization.
He founded Excel Maven in 2014 to provide high-quality, applied analytics training and consulting to clients around the world, and now mentors 25,000+ students in more than 150 countries. He has developed award-winning data analytics and visualization tools, featured by Microsoft, the New York Times, and the Society of American Baseball Research.

KEY FEATURES
During this course, you will build a foundation of working with Excel Macros and VBA. You’ll engage in several projects that will build upon one another as you progress through the basic building blocks of automating tasks within Excel. Soon you’ll be ready to enter the world of Excel VBA, where you will experience a more dynamic, robust experience for yourself and your peers.
- Access 57 lectures & 3.5 hours of content 24/7
- Automate placing & formatting a title on a worksheet
- Interact w/ the users of your Macros through input & message boxes
- Clean up multiple Excel worksheets & prepare the data to be reported on
- Create a report based on multiple sets of data found within multiple Excel worksheets
- Automate the creation of Excel Formulas to SUM data up in your report
PRODUCT SPECS
Details & Requirements
- Length of time users can access this course: lifetime
- Access options: web streaming, mobile streaming
- Certification of completion not included
- Redemption deadline: redeem your code within 30 days of purchase
- Experience level required: all levels
- Microsoft Excel 2010, 2013, or 2016
Compatibility
- Internet required
THE EXPERT
Kyle Pew is a Microsoft Certified Trainer (MCT) and a certified Microsoft Office Master Instructor and has been teaching and consulting for the past 10+ years on various computer applications, including:
- Microsoft Office Suite 1997, 2000, XP, 2003, 2007, 2010, 2013
- Excel, Word, PowerPoint, Outlook, Access and Visio
- SharePoint End-User 2007, 2010, 2013
- VBA (Excel and Access)
- Adobe Suite
- Photoshop, Illustrator, InDesign
- Maya (Modeling and Animation)
- Unity3d (Game Design)
- HTML, CSS and JavaScript
- Crystal Reports
Kyle is a graduate of the San Francisco Art Institute in the Media Arts and Animation Program. He has worked as a Game Designer for Electronic Arts, designing on games such as Nerf N-Strike, Nerf N-Strike Elite, both for the Wii, and a Sims 3 Expansion Pack for the PC.
Kyle has facilitated courses that range from 1-on-1 interactions to large scale groups of 100+ participants, including; live in person classes, webinar style classes online and live online full courses. He is consistently ranked top in reviews for each of the courses he teaches.

KEY FEATURES
More than 750 million people have Excel installed on their computer but most do not know how to use it. Whatever version of Excel you have, this course will show you how to build and prepare a workbook good enough for a Fortune 500 CEO, to a household budget, and everything in between.
- Access 80 lectures & 6.5 hours of content 24/7
- Get downloadable Excel workbooks which you can use to follow along
- Learn how to install Microsoft Excel & work w/ formulas and functions
- Calculate w/ the IF Function & apply conditional formatting
- Use the PMT Function to explore monthly & yearly compounding
- Use Google Drive to collect data
PRODUCT SPECS
Details & Requirements
- Length of time users can access this course: lifetime
- Access options: web streaming, mobile streaming
- Certification of completion not included
- Redemption deadline: redeem your code within 30 days of purchase
- Experience level required: all levels
- Microsoft Excel required
Compatibility
- Internet required
THE EXPERT
Warrick Klimaytys has spent many years with all kinds of computers in many different situations around the world and is eager to share his knowledge and skills with the StackCommerce community.
Around a decade ago Warrick started his professional life in the military where experienced all kinds of computers and machines. Today, he could be referred to as just a Microsoft “Windows Warrior”. As a result of his past experience, he finds it best to deliver lessons in bite sized chunks.
OTHER ARTICLES YOU MAY LIKE

BUILDING SMARTER APPS: WHY THE MOBILE MVP APPROACH WORKS
Creating a successful mobile app is rarely a straight line. You’ve got ideas, users with different needs, and a constantly shifting market. That’s why building a full-scale product right out of the gate can be risky—and expensive. Instead, smart teams are turning to the mobile MVP approach to test ideas, reduce waste, and move fast […]
read more
viewflip – Plus Exclusive Lifetime Deal for $49
viewflip – Plus Exclusive Lifetime Deal for $49 Overview Viewflip is a sidebar that integrates with Windows and macOS apps, so you can collaborate with people on any application. Remote access to any app With viewflip, you can grant remote control of your screen or limit access to select windows—it only takes a couple clicks […]
read more

