Tag Archive: Tableau
The Complete Tableau 10 Data Science Bundle for $12
KEY FEATURES
Corporate executives rely on data to make their decisions, but they don’t have time to pore over pages of spreadsheets. Tableau 10 is the data visualization tool that breaks mounds of information down into clear, actionable insights, making it a valuable tool for any data-driven guru. This course will show you how to get started with Tableau 10, so you can create powerful visualizations and guide your business with solid, accessible answers.
- Access 32 lectures & 2.5 hours of content 24/7
- Discover how to visualize information w/ unique charts & graphs
- Learn from easy-to-follow examples & cover basic and advanced use-case scenarios
- Understand how to create a KPI text table, waterfall chart, population pyramid & more
PRODUCT SPECS
Important Details
- Length of time users can access this course: lifetime
- Access options: web
- Certification of completion not included
- Redemption deadline: redeem your code within 30 days of purchase
- Experience level required: all levels
Requirements
- Internet required
THE EXPERT
Instructor
Packt’s mission is to help the world put software to work in new ways, through the delivery of effective learning and information services to IT professionals. Working towards that vision, it has published over 4,000 books and videos so far, providing IT professionals with the actionable knowledge they need to get the job done–whether that’s specific learning on an emerging technology or optimizing key skills in more established tools.
KEY FEATURES
Tableau is great for distilling mounds of data into smart graphs and charts, but that’s only a fraction of its capabilities. Building on the first volume, this second installment guides you through creating gripping dashboards and story points to communicate your insights to other viewers.
- Access 25 lectures & 2 hours of content 24/7
- Understand how Tableau interacts w/ your data & discover new findings
- Convey your insights w/ dashboards & story points
- Learn how to communicate your findings w/ interactive charts
PRODUCT SPECS
Important Details
- Length of time users can access this course: lifetime
- Access options: web
- Certification of completion not included
- Redemption deadline: redeem your code within 30 days of purchase
- Experience level required: all levels
Requirements
- Internet required
THE EXPERT
Instructor
Packt’s mission is to help the world put software to work in new ways, through the delivery of effective learning and information services to IT professionals. Working towards that vision, it has published over 4,000 books and videos so far, providing IT professionals with the actionable knowledge they need to get the job done–whether that’s specific learning on an emerging technology or optimizing key skills in more established tools.

KEY FEATURES
Tableau 10 has enabled professionals to sift through information and spot trends with a data-driven focus that’s unparalleled in the analytics scene. This course takes you from A to Z with Tableau 10, diving into its visualization tools and familiarizing you with its new Data Prep features.
- Access 33 lectures & 5 hours of content 24/7
- Understand the Tableau fundamentals & learn how to filter data at all levels
- Dive into data intergration w/ Tableau’s new Data Prep feature
- Master advanced calculations, dashboards & visualizations and solve complex queries
PRODUCT SPECS
Important Details
- Length of time users can access this course: lifetime
- Access options: web
- Certification of completion not included
- Redemption deadline: redeem your code within 30 days of purchase
- Experience level required: all levels
Requirements
- Internet required
THE EXPERT
Instructor
Packt’s mission is to help the world put software to work in new ways, through the delivery of effective learning and information services to IT professionals. Working towards that vision, it has published over 4,000 books and videos so far, providing IT professionals with the actionable knowledge they need to get the job done–whether that’s specific learning on an emerging technology or optimizing key skills in more established tools.
KEY FEATURES
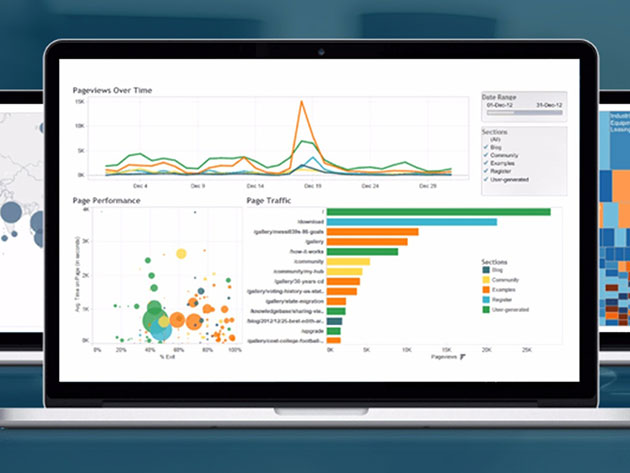
Tableau 10 has changed the way companies work with data, allowing them to distill mounds of scattered information into clear and focused insights. This training uses beginner-friendly, hands-on examples to guide you through the Tableau basics. Jump in, and you’ll get the scoop on this software’s visualization tools and how to inform your business’ decisions with maps, charts, dashboards, and other interactive displays.
- Access 22 lectures & 2 hours of content 24/7
- Follow along bite-sized videos to learn the Tableau fundamentals
- Get started w/ Tableau installation, configuration & set up
- Discover how to create charts, dashboards & other interactive visualizations
PRODUCT SPECS
Important Details
- Length of time users can access this course: lifetime
- Access options: web
- Certification of completion not included
- Redemption deadline: redeem your code within 30 days of purchase
- Experience level required: basic
Requirements
- Internet required
THE EXPERT
Instructor
Eduonix creates and distributes high-quality technology training content. Their team of industry professionals has been training manpower for more than a decade. They aim to teach technology the way it is used in the industry and professional world. They have a professional team of trainers for technologies ranging from Mobility, Web and Enterprise, and Database and Server Administration.

KEY FEATURES
Tableau might come off as intimidating for newcomers, but with a host of practical lessons, this course lets you take on data visualization in a fun and engaging way. With multiple data sets available for download, you can practice preparing and visualizing information with Tableau 10 until you’re a bona fide Tableau analyst.
- Access 72 lectures & 7 hours of content 24/7
- Go from beginner to expert w/ creating real-world data visualizations
- Practice your Tableau skills w/ downloadable practice data sets
- Represent data w/ bar & line charts, maps, and more
PRODUCT SPECS
Important Details
- Length of time users can access this course: lifetime
- Access options: web
- Certification of completion not included
- Redemption deadline: redeem your code within 30 days of purchase
- Experience level required: intermediate
Requirements
- Internet required
THE EXPERT
Instructor
My name is Rob Davis and I am super-excited that you’re here!
Professionally, I am a Business Intelligence consultant with over ten years of experience in government, insurance, manufacturing, healthcare, utilities, higher ed, and other industries. I was trained by the best analytics mentors at Accenture and today I leverage Tableau to drive business strategy, revamp customer experience, and demonstrate the art of the possible.
From my courses you will straight away notice how I combine my real-life experience and academic background to deliver professional step-by-step coaching in the space of Business Intelligence. I am also passionate about helping others and love to see each and every one of my students succeed.
To sum up, I am absolutely and utterly passionate about both Business Intelligence and I am looking forward to sharing my passion and knowledge with you!

The Complete Tableau 10 Data Science Bundle for $19

KEY FEATURES
Course Description
Corporate executives rely on data to make their decisions, but they don’t have time to pore over pages of spreadsheets. Tableau 10 is the data visualization tool that breaks mounds of information down into clear, actionable insights, making it a valuable tool for any data-driven guru. This course will show you how to get started with Tableau 10, so you can create powerful visualizations and guide your business with solid, accessible answers.
- Access 32 lectures & 2.5 hours of content 24/7
- Discover how to visualize information w/ unique charts & graphs
- Learn from easy-to-follow examples & cover basic and advanced use-case scenarios
- Understand how to create a KPI text table, waterfall chart, population pyramid & more
PRODUCT SPECS
Important Details
- Length of time users can access this course: lifetime
- Access options: web
- Certification of completion not included
- Redemption deadline: redeem your code within 30 days of purchase
- Experience level required: all levels
Requirements
- Internet required
THE EXPERT
Instructor
Packt’s mission is to help the world put software to work in new ways, through the delivery of effective learning and information services to IT professionals. Working towards that vision, it has published over 4,000 books and videos so far, providing IT professionals with the actionable knowledge they need to get the job done–whether that’s specific learning on an emerging technology or optimizing key skills in more established tools.

KEY FEATURES
Course Description
Tableau is great for distilling mounds of data into smart graphs and charts, but that’s only a fraction of its capabilities. Building on the first volume, this second installment guides you through creating gripping dashboards and story points to communicate your insights to other viewers.
- Access 25 lectures & 2 hours of content 24/7
- Understand how Tableau interacts w/ your data & discover new findings
- Convey your insights w/ dashboards & story points
- Learn how to communicate your findings w/ interactive charts
PRODUCT SPECS
Important Details
- Length of time users can access this course: lifetime
- Access options: web
- Certification of completion not included
- Redemption deadline: redeem your code within 30 days of purchase
- Experience level required: all levels
Requirements
- Internet required
THE EXPERT
Instructor
Packt’s mission is to help the world put software to work in new ways, through the delivery of effective learning and information services to IT professionals. Working towards that vision, it has published over 4,000 books and videos so far, providing IT professionals with the actionable knowledge they need to get the job done–whether that’s specific learning on an emerging technology or optimizing key skills in more established tools.

KEY FEATURES
Course Description
Tableau 10 has enabled professionals to sift through information and spot trends with a data-driven focus that’s unparalleled in the analytics scene. This course takes you from A to Z with Tableau 10, diving into its visualization tools and familiarizing you with its new Data Prep features.
- Access 33 lectures & 5 hours of content 24/7
- Understand the Tableau fundamentals & learn how to filter data at all levels
- Dive into data intergration w/ Tableau’s new Data Prep feature
- Master advanced calculations, dashboards & visualizations and solve complex queries
PRODUCT SPECS
Important Details
- Length of time users can access this course: lifetime
- Access options: web
- Certification of completion not included
- Redemption deadline: redeem your code within 30 days of purchase
- Experience level required: all levels
Requirements
- Internet required
THE EXPERT
Instructor
Packt’s mission is to help the world put software to work in new ways, through the delivery of effective learning and information services to IT professionals. Working towards that vision, it has published over 4,000 books and videos so far, providing IT professionals with the actionable knowledge they need to get the job done–whether that’s specific learning on an emerging technology or optimizing key skills in more established tools.

KEY FEATURES
Course Description
Tableau 10 has changed the way companies work with data, allowing them to distill mounds of scattered information into clear and focused insights. This training uses beginner-friendly, hands-on examples to guide you through the Tableau basics. Jump in, and you’ll get the scoop on this software’s visualization tools and how to inform your business’ decisions with maps, charts, dashboards, and other interactive displays.
- Access 22 lectures & 2 hours of content 24/7
- Follow along bite-sized videos to learn the Tableau fundamentals
- Get started w/ Tableau installation, configuration & set up
- Discover how to create charts, dashboards & other interactive visualizations
PRODUCT SPECS
Important Details
- Length of time users can access this course: lifetime
- Access options: web
- Certification of completion not included
- Redemption deadline: redeem your code within 30 days of purchase
- Experience level required: basic
Requirements
- Internet required
THE EXPERT
Instructor
Eduonix creates and distributes high-quality technology training content. Their team of industry professionals has been training manpower for more than a decade. They aim to teach technology the way it is used in the industry and professional world. They have a professional team of trainers for technologies ranging from Mobility, Web and Enterprise, and Database and Server Administration.

KEY FEATURES
Course Description
Tableau might come off as intimidating for newcomers, but with a host of practical lessons, this course lets you take on data visualization in a fun and engaging way. With multiple data sets available for download, you can practice preparing and visualizing information with Tableau 10 until you’re a bona fide Tableau analyst.
- Access 72 lectures & 7 hours of content 24/7
- Go from beginner to expert w/ creating real-world data visualizations
- Practice your Tableau skills w/ downloadable practice data sets
- Represent data w/ bar & line charts, maps, and more
PRODUCT SPECS
Important Details
- Length of time users can access this course: lifetime
- Access options: web
- Certification of completion not included
- Redemption deadline: redeem your code within 30 days of purchase
- Experience level required: intermediate
Requirements
- Internet required
THE EXPERT
Instructor
My name is Rob Davis and I am super-excited that you’re here!
Professionally, I am a Business Intelligence consultant with over ten years of experience in government, insurance, manufacturing, healthcare, utilities, higher ed, and other industries. I was trained by the best analytics mentors at Accenture and today I leverage Tableau to drive business strategy, revamp customer experience, and demonstrate the art of the possible.
From my courses you will straight away notice how I combine my real-life experience and academic background to deliver professional step-by-step coaching in the space of Business Intelligence. I am also passionate about helping others and love to see each and every one of my students succeed.
To sum up, I am absolutely and utterly passionate about both Business Intelligence and I am looking forward to sharing my passion and knowledge with you!
February 24, 2017 / by Marco / Bundle, Business', data, deals, design, desktop, entrepreneur, Tableau, Visualization, website

Data Visualization with Tableau Desktop 9 Bundle for $21

KEY FEATURES
Tableau 9 is one of the leading softwares for analyzing and presenting data in meaningful, efficient ways. An essential for data scientists and business analysts alike, having a proficiency in Tableau can separate you from the rest of the job-seeking pack. In this course, you’ll explore the basics of Tableau into more intermediate topics as you prepare for the Tableau Desktop 9 Qualified Associate Certification exam.
- Access 29 lectures & 4.5 hours of content 24/7
- Develop different types of projects & reports in Tableau
- Visualize & present different types of data in an insightful manner
- Locate & clean messy data sets to present them more effectively
- Discover the core concepts needed to start a career in Tableau
PRODUCT SPECS
Details & Requirements
- Length of time users can access this course: lifetime
- Access options: web streaming, mobile streaming
- Certification of completion not included
- Redemption deadline: redeem your code within 30 days of purchase
- Experience level required: all levels
Compatibility
- Internet required
THE EXPERT
GreyCampus transforms careers through skills and certification training. We are a leading provider of training for working professionals in the areas of Project Management, Big Data, Data Science, Service Management and Quality Management. We offer live-online (instructor-led online), classroom (instructor-led classroom) and e-learning (online self-learning ) courses. Our growing suite of accredited courses is constantly upgraded to address the career enhancement goals of working professionals.

KEY FEATURES
Dive into Tableau Desktop 9 and start building data visualizations and dashboards from scratch in this accelerated course. Put yourself at the forefront of the career-hunting workforce by learning this highly in-demand software!
- Access 25 lectures & 1.5 hours of content 24/7
- Install Tableau Desktop 9 on your system
- Analyze & present data using Tableau Desktop 9
- Import & summarize data
- Perform data analysis, visualizations, & create dashboards to present data more efficiently
PRODUCT SPECS
Details & Requirements
- Length of time users can access this course: lifetime
- Access options: web streaming, mobile streaming
- Certification of completion not included
- Redemption deadline: redeem your code within 30 days of purchase
- Experience level required: all levels
Compatibility
- Internet required
THE EXPERT
Sunil Kumar Gupta is a developer, programmer, mentor and all round technology nut. With over 5.6 years of professional experience in the software development as Software Engineer and Technology Analyst, he understands what technology can do for us. He loves building applications using Object Orientated languages & Aspect Orientated programming and has a special love for Data Analysis, Data Science and Analytics.
Sunil is an Oracle Certified Professional, Java SE 6 Programmer and currently works as Technology Analyst at an IT company and he holds a Bachelor of Technology degree in Computer Science & Engineering.

KEY FEATURES
The best way to impress an audience? With visuals. Even better? Interactive and actionable dashboards that audiences can use to really dig into data. Over this extensive course, you’ll learn how businesses use Tableau Desktop 9 to reduce the time and technical acumen required to analyze and publish data. And, moreover, you’ll learn how to actually use this powerful software to achieve similar results.
- Access 40 lectures & 4.5 hours of content 24/7
- Design some of the most common dashboard elements & assemble a complete dashboard
- Use Tactical dashboards for visualizations that can depict progress
- Increase dashboard interactivity by using Operational dashboards
- Explore Analytical dashboards that can provide tools to effectively extract insights from data
- Create a visualization using Ad-hoc dashboards that let you keep an eye on specific areas of interest
- Cover the styling settings & publication options
PRODUCT SPECS
Details & Requirements
- Length of time users can access this course: lifetime
- Access options: web streaming, mobile streaming
- Certification of completion not included
- Redemption deadline: redeem your code within 30 days of purchase
- Experience level required: all levels
Compatibility
- Internet required
THE EXPERT
Tony Kau is a Tableau Desktop 8 Qualified Associate, and he is putting its power to use in his role as a reporting analyst for a Fortune 500 company. His analytical background spans a decade, during which he has used a variety of business intelligence software, though none were better than Tableau. His passion is efficiently leveraging data to inform strategic business decisions.
He holds a degree in Business Administration from the University of Oregon, and his background includes web design, programming, and financial analysis. He currently operates TrendExhaustion.com in his spare time.
January 31, 2017 / by Marco / Bundle, Business', data, deals, design, desktop, entrepreneur, Tableau, Visualization, website

Data Visualization with Tableau Desktop 9 Bundle for $28

KEY FEATURES
Tableau 9 is one of the leading softwares for analyzing and presenting data in meaningful, efficient ways. An essential for data scientists and business analysts alike, having a proficiency in Tableau can separate you from the rest of the job-seeking pack. In this course, you’ll explore the basics of Tableau into more intermediate topics as you prepare for the Tableau Desktop 9 Qualified Associate Certification exam.
- Access 29 lectures & 4.5 hours of content 24/7
- Develop different types of projects & reports in Tableau
- Visualize & present different types of data in an insightful manner
- Locate & clean messy data sets to present them more effectively
- Discover the core concepts needed to start a career in Tableau
PRODUCT SPECS
Details & Requirements
- Length of time users can access this course: lifetime
- Access options: web streaming, mobile streaming
- Certification of completion not included
- Redemption deadline: redeem your code within 30 days of purchase
- Experience level required: all levels
Compatibility
- Internet required
THE EXPERT
GreyCampus transforms careers through skills and certification training. We are a leading provider of training for working professionals in the areas of Project Management, Big Data, Data Science, Service Management and Quality Management. We offer live-online (instructor-led online), classroom (instructor-led classroom) and e-learning (online self-learning ) courses. Our growing suite of accredited courses is constantly upgraded to address the career enhancement goals of working professionals.

KEY FEATURES
Dive into Tableau Desktop 9 and start building data visualizations and dashboards from scratch in this accelerated course. Put yourself at the forefront of the career-hunting workforce by learning this highly in-demand software!
- Access 25 lectures & 1.5 hours of content 24/7
- Install Tableau Desktop 9 on your system
- Analyze & present data using Tableau Desktop 9
- Import & summarize data
- Perform data analysis, visualizations, & create dashboards to present data more efficiently
PRODUCT SPECS
Details & Requirements
- Length of time users can access this course: lifetime
- Access options: web streaming, mobile streaming
- Certification of completion not included
- Redemption deadline: redeem your code within 30 days of purchase
- Experience level required: all levels
Compatibility
- Internet required
THE EXPERT
Sunil Kumar Gupta is a developer, programmer, mentor and all round technology nut. With over 5.6 years of professional experience in the software development as Software Engineer and Technology Analyst, he understands what technology can do for us. He loves building applications using Object Orientated languages & Aspect Orientated programming and has a special love for Data Analysis, Data Science and Analytics.
Sunil is an Oracle Certified Professional, Java SE 6 Programmer and currently works as Technology Analyst at an IT company and he holds a Bachelor of Technology degree in Computer Science & Engineering.

KEY FEATURES
The best way to impress an audience? With visuals. Even better? Interactive and actionable dashboards that audiences can use to really dig into data. Over this extensive course, you’ll learn how businesses use Tableau Desktop 9 to reduce the time and technical acumen required to analyze and publish data. And, moreover, you’ll learn how to actually use this powerful software to achieve similar results.
- Access 40 lectures & 4.5 hours of content 24/7
- Design some of the most common dashboard elements & assemble a complete dashboard
- Use Tactical dashboards for visualizations that can depict progress
- Increase dashboard interactivity by using Operational dashboards
- Explore Analytical dashboards that can provide tools to effectively extract insights from data
- Create a visualization using Ad-hoc dashboards that let you keep an eye on specific areas of interest
- Cover the styling settings & publication options
PRODUCT SPECS
Details & Requirements
- Length of time users can access this course: lifetime
- Access options: web streaming, mobile streaming
- Certification of completion not included
- Redemption deadline: redeem your code within 30 days of purchase
- Experience level required: all levels
Compatibility
- Internet required
THE EXPERT
Tony Kau is a Tableau Desktop 8 Qualified Associate, and he is putting its power to use in his role as a reporting analyst for a Fortune 500 company. His analytical background spans a decade, during which he has used a variety of business intelligence software, though none were better than Tableau. His passion is efficiently leveraging data to inform strategic business decisions.
He holds a degree in Business Administration from the University of Oregon, and his background includes web design, programming, and financial analysis. He currently operates TrendExhaustion.com in his spare time.

